Why Untappd Ratings Don't Matter
In a world where ratings are prevalent and data constantly discussed, what really matters? Do you rate an Uber driver within the first 2 minutes of your drive? Do you complete an Airbnb review before the stay is over? Does this data impact your future decisions and purchases? Will you choose not to visit a brewery because their Untappd rating is 0.1 below your unwritten cutoff?
An online poll via Facebook consisting of 1600 respondents found that 80 percent of craft beer drinkers do not check a brewery’s Untappd rating prior to visiting. Even if they did check, would that rating give any insight into the potential quality of their visit? The answer is no.
The difference in Untappd ratings between breweries in negligible. Thus, the difference between an average beer and world class beer is merely a few tenths of a decimal. Does this Untappd data correlate significantly to a brewery’s ultimate success? Once again, the answer is no. Breweries need to continue asking themselves, “if everyone is making quality beer, how do we stand out?”
Through a Secret Hopper study consisting of 5256 non-paid brewery visits at 4149 unique locations, we analyzed the relationship of a brewery’s Untappd rating and a variety of data points surrounding everything from the amount a guest will spend to how long they hang out. The goal of our study is to take a deeper dive into if a brewery’s Untappd rating affects any predictors to how successful a brewery can be.
Untappd uses the following formula to determine a brewery’s rating.

In our study, the difference between the highest (4.43) and lowest (2.47) rated brewery is 1.96. The average Untappd rating from our study is 3.71

Let’s begin with spending. For our data set, the average person spends $42.93. All spending data represents a customer’s total amount spent, including their tip and all guests on their tab.

And now broken down a tad deeper.
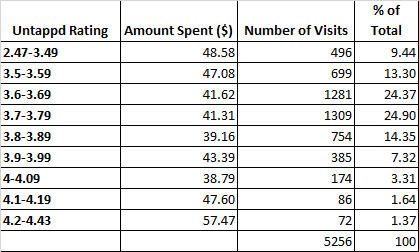
Over half of breweries fall within the 3.5 to 3.74 range. This is essentially 4428 breweries within 0.24. Is this range significant? Equally as interesting, the 496 guests that visits breweries rated 2.47 to 3.49 spend on average nearly 17 percent more than guests visiting breweries rated 3.75 to 3.99. Why is this? Are those breweries with lower rated beer putting their focus into other aspects of their business that can impact a guest’s spending habits?
Countless factors influence how good a beer tastes. This includes the beer itself, but also the memory the experience that surrounds it. Taste does not equal experience. We are not going to point out any flaws in the Untappd system, but rather show relationships between their data and additional facets of a brewery experience.
Let’s take a look at how engagement factors into the mix. We define the levels of engagement as the following:
Low: The staff does not attempt to build a connection with the guest and is absent for the bulk of the guest's visit.
Neutral: The staff goes through the motions, neither impressing or disappointing the guest.
Moderate: The staff greets the guest, offers recommendations, and checks back in a timely fashion.
High: The staff goes above and beyond moderate, "wow"-ing the guest.
For this sample set, when a guest receives high engagement, they spend $44.42, 13 percent more than a guest receiving low engagement. Engaged guests spend more money, but does the beer taste any better? On all visits when guests received high engagement, the average Untappd rating was 3.71. On visits when they receive low engagement, the average Untappd rating was 3.69. This is a difference of 0.02. The quality of a beer does not meaningfully impact a guest’s spending habits, the level of staff engagement does.

Looking at the same Untappd/engagement data from a different angle, are breweries with higher ratings likely to give higher levels of engagement? The answer is yes. Breweries rated 4-4.43 provide high engagement 6 percent more frequently than breweries rated 2.47-3.49.

We see that high engagement is given more frequently alongside higher rated beer, but do these visits result in guests spending more? The guest receiving high engagement at 4-4.43 rated breweries spends on average 95 cents more than a guest receiving high engagement at a 2.47-3.49 rated brewery. We look forward to seeing how this data set evolves with a larger number of samples.

Next, let’s look at whether guests spend more time at breweries with higher Untappd ratings. Guests spend the most time at breweries rated 3.75-3.99 and the least time at breweries rated 4-4.43.

Is this because a greater portion of the guests visiting 4-4.43 rated breweries may visit with the goal of purchasing beer to go? On visits when guests purchased to go beer, the average Untappd rating was 3.77, versus 3.70 when they did not purchase to go. The guests who purchased to go spent an average of $53.46 versus those who didn’t make the added purchase spending $40.68. This is a 31.4 percent increase when the guest purchases beer to go.

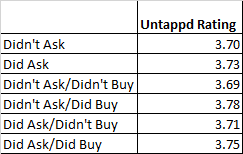
The below chart references whether staff asked the guest if they would like to purchase any beer to go, and if they made the added purchase. In cases when staff didn’t ask guests about beer to go and they still made the purchase, the brewery rating was the highest at 3.78. When neither the staff member encouraged a to go purchase and the guest didn’t make it, the brewery was rated 3.69 – the lowest from this data set, although the range between all options is only 0.09.
All shoppers selected whether they considered themselves a “new beer drinker,” “social drinker,” or “beer nerd.” New beer drinkers visited breweries with an average Untappd rating of 3.66. Social drinkers visited breweries with an average of 3.69, and beer nerds 3.73. It can be argued that the more experienced the craft beer drinker, the more likely they are to seek out breweries with higher ratings. While very minimal, those that visit more breweries per month visit breweries with a higher Untappd rating.

As seen below, breweries with higher Untappd ratings appear to be busier. However, the average Untappd rating between an empty brewery and a packed brewery is only 0.05.

Visiting a brewery once is great, but what causes guests to return? A return customer has greater financial value to a brewery than a one-time visitor. Those guests that stated they planned to visit the brewery again within 1 to 7 days visited breweries with average Untappd ratings of 3.70. Those who said they do not plan to return visited breweries with an average rating of 3.66. Additionally, a greater percentage of guests visiting lower rated breweries state they plan to return within 1-7 days than higher rated breweries.

The below chart shows the relationship between a brewery’s Untappd score and the percentage frequency of how soon a guest is likely to return.

Beer quality matters. No longer can a brewery just make decent beer and expect to survive long term. However, as shown by the above data, the range in breweries’ Untappd ratings is very minimal. While Untappd may be a great way to log your beer history, it is not a reliable data point to compare beer quality or a valuable predictor to how profitable a brewery will be. Beer quality is merely just one piece of the pie.
We live in a time where everything is about experience, and everything is your brewery’s competition. It’s not just about Big Beer and their (typically) lower Untappd ratings. Every activity your potential guest can choose to do instead of visiting your brewery is your competition and your goal should be to create the most unforgettable experiences. Stop worrying about Untappd ratings and focus on what really matters – making craft beer memories that make guests crave to return. This is how to survive.
We would love to offer any brewery that reaches out after reading this article one free Secret Hop*. Please email andrew@secrethopper.com to schedule. Cheers!
*1 free visit per brewery per calendar year